| Area | Freshwater Creek-Ryan Slough |
| Topic | Aquatic Insects: EPT Main Freshwater Below the SF 1994-1998 |
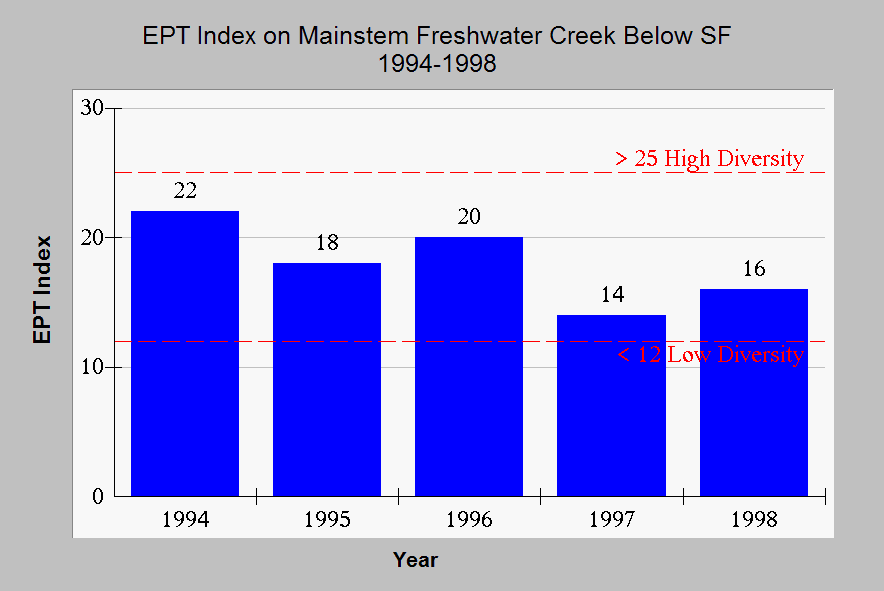
| Caption: This chart shows the change in the number of mayfly, stonefly and caddisfly taxa, which comprise the EPT index, for the PL monitoring station below the South Fork Freshwater Creek (#34) for the years 1994 through 1998. Reference lines shown are those taken from Harrington (1999) in characterizing the health of aquatic communities, where more than 25 species indicate high quality aquatic habitat while a community with fewer than 12 taxa indicates impairment. See Picture for map image of monitoring location. Data from the PALCO. | |
 |
To learn more about this topic click Info Links .
To view additional information (data source, aquisition date etc.) about this page, click Metadata .
To view the table with the chart's data, click Chart Table web page.
To download the table with the chart's data, click lmfw9498.dbf (size 1,055 bytes)
To download the table with the chart's data as an Excel spreadsheet, click lmfw9498.dbf.xls (size 4,096 bytes) .
| www.krisweb.com |
