| Area | Basin-wide |
| Topic | Aquatic Inverts: Percent Dominant Taxa, All Samples |
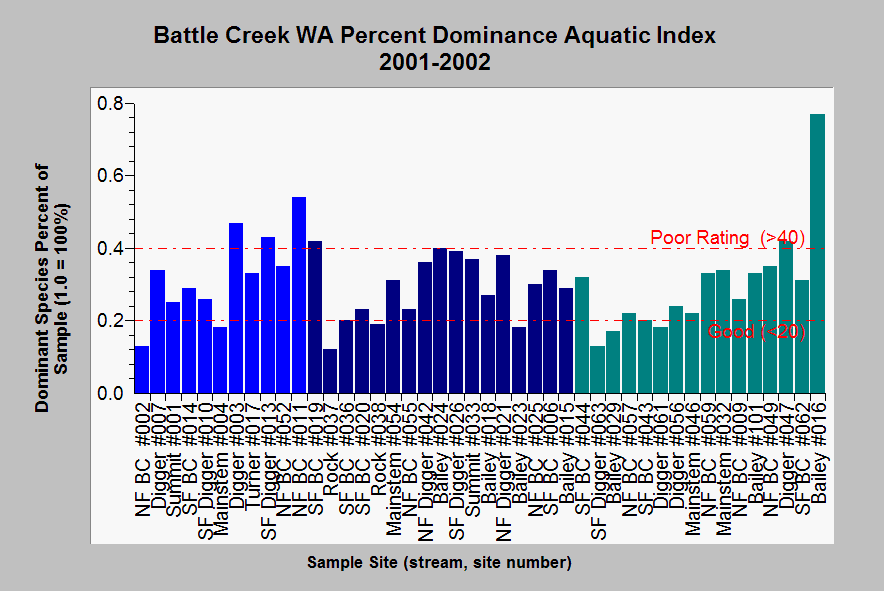
| Caption: This chart shows the percentage of samples of aquatic invertebrates dominated by one taxa for all Battle Creek Watershed Assessment sites as measured in Fall 2001 (light blue), Spring 2002 (dark blue) and Fall 2002 (teal). The reference on the chart of more than 40% being poor habitat and one species dominating less than 20% as indicating good habitat comes from Hafele and Mulvey (1998) as cited by Ward and Kvam (2003). The lowest scores (best health) are at site #037 (Rock Creek) in spring 2002 and at #063 (SF Digger) in fall 2002. The highest scores (poorer health) were at sites #016 (Bailey Creek) and #011 (NF Battle). Data from Ward and Kvam (2003). See Info Links for more information and Map of locations WA sites. | |
 |
To learn more about this topic click Info Links .
To view additional information (data source, aquisition date etc.) about this page, click Metadata .
To view the table with the chart's data, click Chart Table web page.
To download the table with the chart's data, click aq_inverts_01_02.dbf (size 8,738 bytes)
To download the table with the chart's data as an Excel spreadsheet, click aq_inverts_01_02.dbf.xls (size 19,714 bytes) .
| www.krisweb.com |
