| Area | Basin-wide |
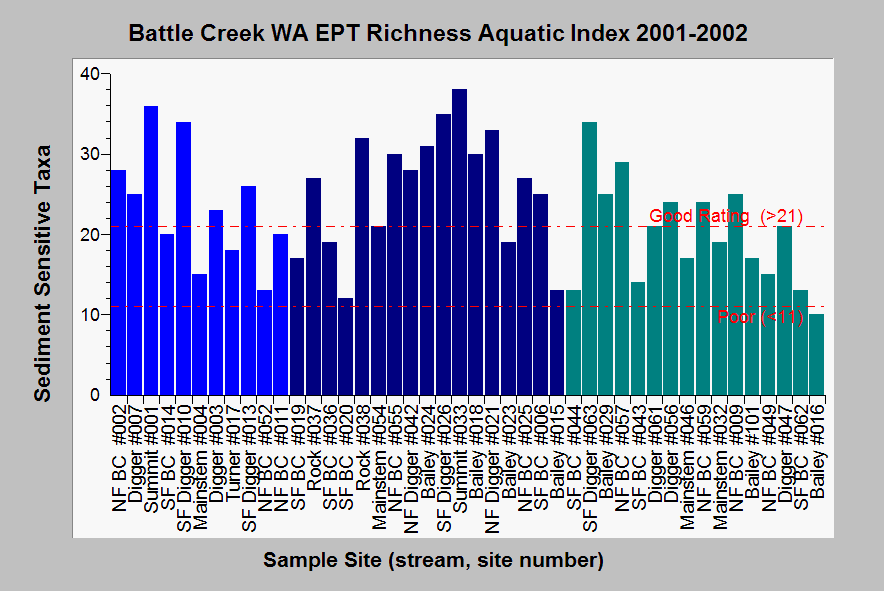
| Topic | Aquatic Inverts: EPT Taxa Richness, All Samples |
| Caption: This chart shows the number of pollution intolerant taxa from the orders of the mayflies (Ephemeroptera), stoneflies (Plecoptera) and caddisflies (Tricoptera) as the EPT Richness Index. These samples were taken as part of the Battle Creek Watershed Assessment and sites were measured in Fall 2001 (light blue), Spring 2002 (dark blue) and Fall 2002 (teale). The reference on the chart of more than 21 taxa indicating good habitat and fewer than 11 as poor comes from Hafele and Mulvey (1998) as cited by Ward and Kvam (2003). The highest scores are on USFS lands or in upper watersheds; however, taxonomic richness does decrease naturally somewhat in larger order streams. Data from Ward and Kvam (2003). See Info Links for more information and Map of locations WA sites. | |
 |
To learn more about this topic click Info Links .
To view additional information (data source, aquisition date etc.) about this page, click Metadata .
To view the table with the chart's data, click Chart Table web page.
To download the table with the chart's data, click aq_inverts_01_02.dbf (size 8,738 bytes)
To download the table with the chart's data as an Excel spreadsheet, click aq_inverts_01_02.dbf.xls (size 19,714 bytes) .
| www.krisweb.com |
